
Display statistical result in a simple table, where the rows and columns are depending on the statistic result grouping.
code_blocksDesign View
In the template editor, you can find the Table icon 
You can drag the widget into the grid and then configure the following sub-elements according to your needs:

Below are references to the properties that can be configured for this widget.
For more details on how to manage statistics, you can refer to this article.
code_blocksCode View
Template Syntax
Below you can find some examples of how to use the component within a template.
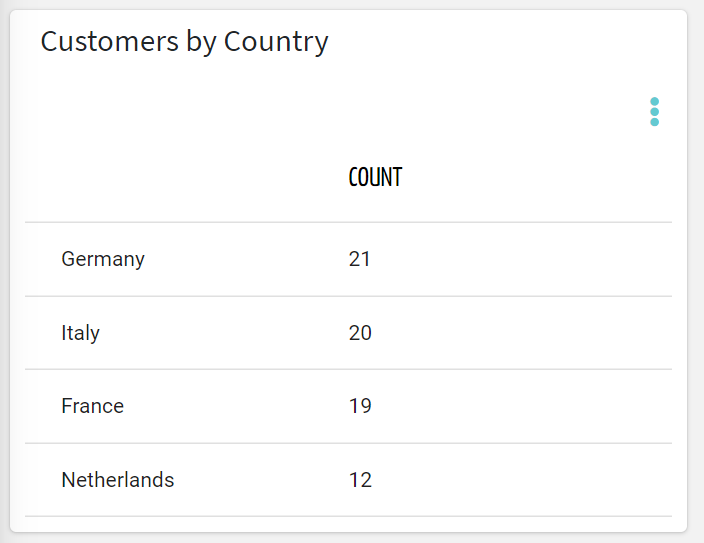
<table-widget [title]="'Customer by Country'">
    <statistic name="customerCount" [groupBy]="['country']"></statistic>
</table-widget>
Component Reference
Here is a comprehensive list of all the elements and properties that can be used to configure the component.
| Table <table-widget> | |
|---|---|
| PROPERTIES | |
| Category Filter | The name of the filter used to transform category names. Type: FILTER | Optional categoryFilter="FILTER" |
| CSS Class | The name(s) of the CSS class used to customize the widget layout. Type: STRING | Optional class="my-custom-class" |
| Export Enabled | The boolean flag indicating whether the data export is enabled. Type: BOOLEAN | Optional | Values: true
false
[exportEnabled]="true" |
| Period Filter Enabled | The boolean flag indicating whether the embedded period filter is available. Type: BOOLEAN | Optional | Values: true
false
[filterEnabled]="true" |
| Query Variable | The id of the page's <things-filter-field> used for searching. Type: STRING | Optional queryFieldRef="query-1" |
| Title | The title displayed on the top part of the widget box. Type: STRING | Optional [title]="'Details'" |
| Value Filter | The name of the filter used to transform values. Type: FILTER | Optional valueFilter="FILTER" |
| Visibility Condition | The expression that allows you to reduce the visibility of the element. Type: STRING | Optional *ngIf="getUser().organizationId != null" |
| SUB-ELEMENTS | |
| Statistic | The statistic whose values are to be displayed in the table. Single | Required <statistic name="alertCount" resource="ALERT"></statistic> |
| Statistic <statistic> | |
|---|---|
| PROPERTIES | |
| Aggregation | The function used to aggregate data. Type: ENUM | Optional | Values: AVG
COUNT
MAX
MIN
SUM
aggregation="MAX" |
| Alert Status | Define whether to include alerts that are still active, or have been activated in a period. Type: ENUM | Optional | Values: ACTIVE
ACTIVATED
activationType="ACTIVATED" |
| Averaged By | The count used to average the statistic results (e.g. Average alert count by thing). Type: ENUM | Optional | Values: thingCount averagedBy="thingCount" |
| Group By | The property used to group results. For instance: customer.country. In the case where the underlying objects are temporally distributed you can also aggregate by HOUR, DAY, MONTH and YEAR. Type: GROUP_BY | Optional groupBy="customer.name" |
| Max Result Count | The number of maximum returned results (default all results are returned). Type: INTEGER | Optional [limit]="123" |
| Period Variable | The id of the page's variable providing the date range filtering period, for instance the id of a <period-filter-field>. Type: STRING | Optional periodRef="period" |
| Property | The object property whose values must be aggregated. Type: PROPERTY | Optional property="PROPERTY" |
| Query | The array of conditions filtering out items. For instance: [query]='[{'property': 'connectionStatus', 'predicate': 'eq', 'value': '1'}]' Predicates: eq, beginsWith, like, notLike, isEmpty, isNotEmpty, gt, gte, lt, lte. Type: QUERY | Optional query="[{'property': 'connectionStatus', 'predicate': 'eq', 'value': '1'}, {...}]" |
| Resource | The resource from which to retrieve the items to be used to calculate the statistic. Type: ENUM | Required | Values: ACTION
ALERT
CUSTOMER
LOCATION
PARTNER
THING
USER
WORK_SESSION
resource="ALERT" |
| Sorting | The sort direction used to order categories by value (default none). Type: ENUM | Optional | Values: ASC
DESC
sortDirection="DESC" |
| Value Filter | The name of the filter used to transform and display values. Type: FILTER | Optional filter="fooBarFilter" |
| Alert Category | The alert category used to filter the statistic results. Type: ENUM_ARRAY | Optional | Values: INFORMATION
ADVICE
ANOMALY
FAILURE
SAFETY
[category]="['ANOMALY', 'FAILURE']" [DEPRECATED] Define a condition into the query property
|
| Alert Severity | The alert severity used to filter the statistic results. Type: ENUM_ARRAY | Optional | Values: INFORMATIONAL
WARNING
CRITICAL
EMERGENCY
[severity]="['WARNING', 'CRITICAL']" [DEPRECATED] Define a condition into the query property.
|
| End Date Variable | The <period-field>'s End Variable filtering data by end date. Type: STRING | Optional endDateFieldRef="toDate" [DEPRECATED] Use the Period Variable property.
|
| Include Zero Values | The flag indicating whether to include or not the alerts with zero occurrences. Type: BOOLEAN | Optional | Values: true
false
[includeZeroValues]="true" [DEPRECATED] This feature is no longer supported.
|
| Name | The statistic whose results(s) must be loaded by the widget. Type: STATISTIC | Required | Values: activeAlertCount
activatedAlertCount
alertCount
alertCountByAlertDefinition
thingCount
thingPropertyAggregation
locationCount
customerCount
userCount
workSessionCount
workSessionCount
workSessionElapsedTime
workSessionSumMetricValues
name="alertCount" [DEPRECATED] Use the Resource, and select the Aggregation and Property to aggregate.
|
| Start Date Variable | The <period-field>'s Start Variable filtering data by start date. Type: STRING | Optional startDateFieldRef="fromDate" [DEPRECATED] Use the Period Variable property instead.
|
| Sum Metric | The work-session monitored metric to sum. Type: STRING | Optional sumMetric="metrics.Pieces.DELTA" [DEPRECATED] Use the Resource property and select the Aggregation and the Property to aggregate.
|
| Thing Definition | The name of the thing-definition used to filter the statistic results. Type: STRING | Optional thingDefinition="fooBar" [DEPRECATED] Define a condition into the query property
|
Comments
0 comments
Please sign in to leave a comment.