
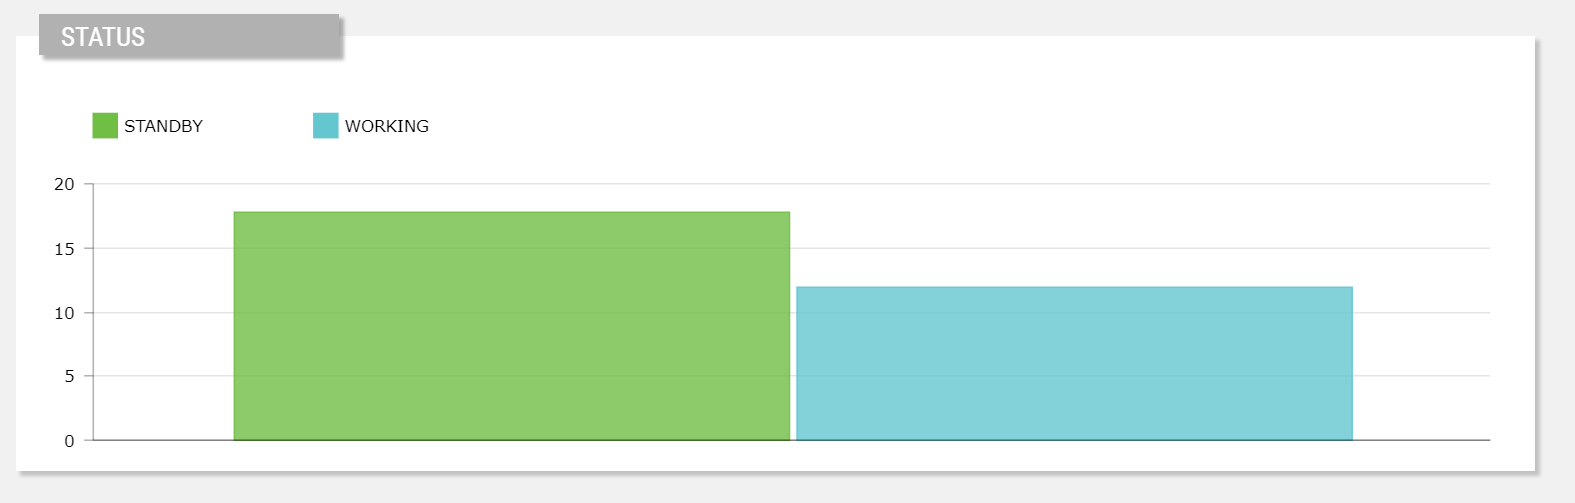
Displays a bar graph with a bar for each metric value or statistic result.
[DEPRECATED] Use the new Bar Chart.
code_blocksCode View
Template Syntax
Below you can find some examples of how to use the component within a template.
<bar-chart-widget title="Counters">
   <metric name="Working Hours"></metric>
   <metric name="Standby Hours"></metric>
   <metric name="Heating Hours"></metric>
</bar-chart-widget>
Component Reference
Here is a comprehensive list of all the elements and properties that can be used to configure the component.
| Bar Chart (OLD) <bar-chart-widget> | |
|---|---|
| PROPERTIES | |
| Category | The grouping criteria in case of metrics with multiple values. Type: ENUM | Optional | Values: METRIC KEY category="KEY" |
| Color Filter | The filter function used to draw values using a common color palette. Type: FILTER | Optional colorFilter="myColorFilter" |
| Colors | The color palette used by the widget (e.g. ['#00a659', '#d3d3d3']) Type: JSON | Optional [colors]="['#00a659', '#d3d3d3']" |
| CSS Class | The name(s) of the CSS class used to customize the widget layout. Type: STRING | Optional class="my-custom-class" |
| Height | The height of the widget (e.g. 250px). Type: STRING | Optional height="250px" |
| Legend Position | The position where the chart legend must be placed. Type: ENUM | Optional | Values: bottom top left right none legendPosition="top" |
| Show Bars Horizontally | The flag indicating whether to display bars horizontally or vertically. Type: BOOLEAN | Optional | Values: true false [rotate]="true" |
| Show Category | The flag indicating whether to display or not the category name under each bar. Type: BOOLEAN | Optional | Values: true false [showCategory]="true" |
| Title | The title displayed on the top part of the widget box. Type: STRING | Optional [title]="'Details'" |
| Visibility Condition | The expression that allows you to reduce the visibility of the element. Type: STRING | Optional *ngIf="getUser().organizationId != null" |
| Width | The width of the widget (e.g. 500px). Type: STRING | Optional width="500px" |
| SUB-ELEMENTS | |
| Metric | The metric whose label and current value must be rendered as a bar within the chart. Multiple | Required <metric name="Temperature"></metric> |
| Statistic | The statistic whose values must be rendered as a bar within the chart. Single | Required <statistic name="alertCount" resource="ALERT"></statistic> |
| Metric <metric> | |
|---|---|
| PROPERTIES | |
| Filter | The name of the filter used to transform and display values. Type: FILTER | Optional filter="fooBarFilter" |
| Label | The metric alternative label. Type: STRING | Optional label="Temperature" |
| Name | The metric whose value(s) must be loaded by the widget. Type: METRIC | Required name="Temperature" |
| Unit | The unit of measurement to be displayed along the value. Type: STRING | Optional unit="°C" |
| Visibility Condition | The expression that allows you to reduce the visibility of the element. Type: STRING | Optional *ngIf="getUser().organizationId != null" |
| Statistic <statistic> | |
|---|---|
| PROPERTIES | |
| Aggregation | The function used to aggregate data. Type: ENUM | Optional | Values: AVG COUNT MAX MIN SUM aggregation="MAX" |
| Alert Status | Define whether to include alerts that are still active, or have been activated in a period. Type: ENUM | Optional | Values: ACTIVE ACTIVATED activationType="ACTIVATED" |
| Averaged By | The count used to average the statistic results (e.g. Average alert count by thing). Type: ENUM | Optional | Values: thingCount averagedBy="thingCount" |
| Group By | The property used to group results. For instance: customer.country. In the case where the underlying objects are temporally distributed you can also aggregate by HOUR, DAY, MONTH and YEAR. Type: GROUP_BY | Optional groupBy="customer.name" |
| Max Result Count | The number of maximum returned results (default all results are returned). Type: INTEGER | Optional [limit]="123" |
| Period Variable | The id of the page's variable providing the date range filtering period, for instance the id of a <period-filter-field>. Type: STRING | Optional periodRef="period" |
| Property | The object property whose values must be aggregated. Type: PROPERTY | Optional property="PROPERTY" |
| Query | The array of conditions filtering out items. For instance: [query]='[{'property': 'connectionStatus', 'predicate': 'eq', 'value': '1'}]' Predicates: eq, beginsWith, like, notLike, isEmpty, isNotEmpty, gt, gte, lt, lte. Type: JSON | Optional [query]="[{'property': 'connectionStatus', 'predicate': 'eq', 'value': '1'}, {...}]" |
| Resource | The resource from which to retrieve the items to be used to calculate the statistic. Type: ENUM | Required | Values: ACTION ALERT CUSTOMER LOCATION PARTNER THING USER WORK_SESSION resource="ALERT" |
| Sorting | The sort direction used to order categories by value (default none). Type: ENUM | Optional | Values: ASC DESC sortDirection="DESC" |
| Value Filter | The name of the filter used to transform and display values. Type: FILTER | Optional filter="fooBarFilter" |
| Alert Category | The alert category used to filter the statistic results. Type: ENUM_ARRAY | Optional | Values: INFORMATION ADVICE ANOMALY FAILURE SAFETY [category]="['ANOMALY', 'FAILURE']" [DEPRECATED] Define a condition into the query property |
| Alert Severity | The alert severity used to filter the statistic results. Type: ENUM_ARRAY | Optional | Values: INFORMATIONAL WARNING CRITICAL EMERGENCY [severity]="['WARNING', 'CRITICAL']" [DEPRECATED] Define a condition into the query property. |
| End Date Variable | The <period-field>'s End Variable filtering data by end date. Type: STRING | Optional endDateFieldRef="toDate" [DEPRECATED] Use the Period Variable property. |
| Include Zero Values | The flag indicating whether to include or not the alerts with zero occurrences. Type: BOOLEAN | Optional | Values: true false [includeZeroValues]="true" [DEPRECATED] This feature is no longer supported. |
| Name | The statistic whose results(s) must be loaded by the widget. Type: STATISTIC | Required | Values: activeAlertCount activatedAlertCount alertCount alertCountByAlertDefinition thingCount thingPropertyAggregation locationCount customerCount userCount workSessionCount workSessionCount workSessionElapsedTime workSessionSumMetricValues name="alertCount" [DEPRECATED] Use the Resource, and select the Aggregation and Property to aggregate. |
| Start Date Variable | The <period-field>'s Start Variable filtering data by start date. Type: STRING | Optional startDateFieldRef="fromDate" [DEPRECATED] Use the Period Variable property instead. |
| Sum Metric | The work-session monitored metric to sum. Type: STRING | Optional sumMetric="metrics.Pieces.DELTA" [DEPRECATED] Use the Resource property and select the Aggregation and the Property to aggregate. |
| Thing Definition | The name of the thing-definition used to filter the statistic results. Type: STRING | Optional thingDefinition="fooBar" [DEPRECATED] Define a condition into the query property |
Comments
0 comments
Please sign in to leave a comment.