
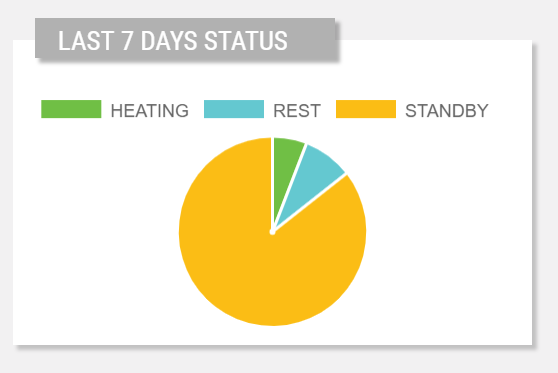
Displays a pie chart with one slice for each referenced metric value or statistic result.
code_blocksDesign View
In the template editor, you can find the Pie Chart icon 
You can drag the widget into the grid and then configure the following sub-elements according to your needs:

Below are references to the properties that can be configured for this widget.
For more details on how to manage metrics, you can refer to this article.

Below are references to the properties that can be configured for this widget.
For more details on how to manage statistics, you can refer to this article.
code_blocksCode View
Template Syntax
Below you can find some examples of how to use the component within a template.
<pie-chart-widget title="Counters">
   <metric name="Standby Hours"></metric>
   <metric name="Rest Hours"></metric>
   <metric name="Heating Hours"></metric>
</pie-chart-widget>
Component Reference
Here is a comprehensive list of all the elements and properties that can be used to configure the component.
| Pie Chart <pie-chart-widget> | |
|---|---|
| PROPERTIES | |
| Chart Options | The JSON configuring how the chart is rendered, for more details see the Chart JS documentation. Type: JSON | Optional [globalChartOptions]="{foo: 'bar'}" |
| Color Filter | The filter function used to draw values using a common color palette. Type: FILTER | Optional colorFilter="myColorFilter" |
| CSS Class | The name(s) of the CSS class used to customize the widget layout. Type: STRING | Optional class="my-custom-class" |
| Height | The height of the widget (e.g. 250px). Type: STRING | Optional height="250px" |
| Title | The title displayed on the top part of the widget box. Type: STRING | Optional [title]="'Details'" |
| Visibility Condition | The expression that allows you to reduce the visibility of the element. Type: STRING | Optional *ngIf="getUser().organizationId != null" |
| Width | The width of the widget (e.g. 500px). Type: STRING | Optional width="500px" |
| SUB-ELEMENTS | |
| Metric | The metric whose value must be rendered as a slice within the chart. Multiple | Required <metric name="Temperature"></metric> |
| Statistic | The statistic whose values must be rendered as a slices within the chart. Multiple | Required <statistic name="alertCount" resource="ALERT"></statistic> |
| Metric <metric> | |
|---|---|
| PROPERTIES | |
| Filter | The name of the filter used to transform and display values. Type: FILTER | Optional filter="fooBarFilter" |
| Label | The metric alternative label. Type: STRING | Optional label="Temperature" |
| Name | The metric whose value(s) must be loaded by the widget. Type: METRIC | Required name="Temperature" |
| Unit | The unit of measurement to be displayed along the value. Type: STRING | Optional unit="°C" |
| Visibility Condition | The expression that allows you to reduce the visibility of the element. Type: STRING | Optional *ngIf="getUser().organizationId != null" |
| Statistic <statistic> | |
|---|---|
| PROPERTIES | |
| Aggregation | The function used to aggregate data. Type: ENUM | Optional | Values: AVG
COUNT
MAX
MIN
SUM
aggregation="MAX" |
| Alert Status | Define whether to include alerts that are still active, or have been activated in a period. Type: ENUM | Optional | Values: ACTIVE
ACTIVATED
activationType="ACTIVATED" |
| Averaged By | The count used to average the statistic results (e.g. Average alert count by thing). Type: ENUM | Optional | Values: thingCount averagedBy="thingCount" |
| Group By | The property used to group results. For instance: customer.country. In the case where the underlying objects are temporally distributed you can also aggregate by HOUR, DAY, MONTH and YEAR. Type: GROUP_BY | Optional groupBy="customer.name" |
| Max Result Count | The number of maximum returned results (default all results are returned). Type: INTEGER | Optional [limit]="123" |
| Period Variable | The id of the page's variable providing the date range filtering period, for instance the id of a <period-filter-field>. Type: STRING | Optional periodRef="period" |
| Property | The object property whose values must be aggregated. Type: PROPERTY | Optional property="PROPERTY" |
| Query | The array of conditions filtering out items. For instance: [query]='[{'property': 'connectionStatus', 'predicate': 'eq', 'value': '1'}]' Predicates: eq, beginsWith, like, notLike, isEmpty, isNotEmpty, gt, gte, lt, lte. Type: QUERY | Optional query="[{'property': 'connectionStatus', 'predicate': 'eq', 'value': '1'}, {...}]" |
| Resource | The resource from which to retrieve the items to be used to calculate the statistic. Type: ENUM | Required | Values: ACTION
ALERT
CUSTOMER
LOCATION
PARTNER
THING
USER
WORK_SESSION
resource="ALERT" |
| Sorting | The sort direction used to order categories by value (default none). Type: ENUM | Optional | Values: ASC
DESC
sortDirection="DESC" |
| Value Filter | The name of the filter used to transform and display values. Type: FILTER | Optional filter="fooBarFilter" |
| Alert Category | The alert category used to filter the statistic results. Type: ENUM_ARRAY | Optional | Values: INFORMATION
ADVICE
ANOMALY
FAILURE
SAFETY
[category]="['ANOMALY', 'FAILURE']" [DEPRECATED] Define a condition into the query property
|
| Alert Severity | The alert severity used to filter the statistic results. Type: ENUM_ARRAY | Optional | Values: INFORMATIONAL
WARNING
CRITICAL
EMERGENCY
[severity]="['WARNING', 'CRITICAL']" [DEPRECATED] Define a condition into the query property.
|
| End Date Variable | The <period-field>'s End Variable filtering data by end date. Type: STRING | Optional endDateFieldRef="toDate" [DEPRECATED] Use the Period Variable property.
|
| Include Zero Values | The flag indicating whether to include or not the alerts with zero occurrences. Type: BOOLEAN | Optional | Values: true
false
[includeZeroValues]="true" [DEPRECATED] This feature is no longer supported.
|
| Name | The statistic whose results(s) must be loaded by the widget. Type: STATISTIC | Required | Values: activeAlertCount
activatedAlertCount
alertCount
alertCountByAlertDefinition
thingCount
thingPropertyAggregation
locationCount
customerCount
userCount
workSessionCount
workSessionCount
workSessionElapsedTime
workSessionSumMetricValues
name="alertCount" [DEPRECATED] Use the Resource, and select the Aggregation and Property to aggregate.
|
| Start Date Variable | The <period-field>'s Start Variable filtering data by start date. Type: STRING | Optional startDateFieldRef="fromDate" [DEPRECATED] Use the Period Variable property instead.
|
| Sum Metric | The work-session monitored metric to sum. Type: STRING | Optional sumMetric="metrics.Pieces.DELTA" [DEPRECATED] Use the Resource property and select the Aggregation and the Property to aggregate.
|
| Thing Definition | The name of the thing-definition used to filter the statistic results. Type: STRING | Optional thingDefinition="fooBar" [DEPRECATED] Define a condition into the query property
|
Comments
0 comments
Please sign in to leave a comment.