Grouped thing list widget
A new widget that groups things according to a certain property. Each group can then be expanded by loading associated products. In this way, you can provide your customers with a different way to access their products. For instance, grouping products by model, location, or tag.
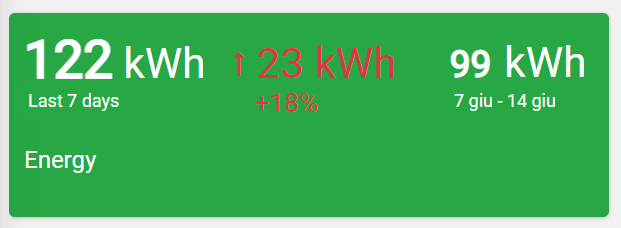
Gauge widget with previous period value
The gauge widget now can include also the previous value with respect to the requested period. So, now you can configure a gauge displaying the current value, the previous value, and the increment absolute and/or percentage.

Under current and previous values, the reference period has been formatted in a friendlier way, making it easier to understand the data displayed.
Time-series chart widget with new aggregation timeframes
Within the time-series chart widget, you can display data by using a finest aggregation than an hour, for instance, every 5, 10, and 30 minutes. In this way, when zooming in, more fine data can be visualized.
In addition, on the opposite end, year aggregation can now also be used to display data over several years. For instance, you can compare energy consumption by year.
Visual editor updates
The add sub-element button, is always visible, allowing you to add more sub-element faster.

When adding a metric sub-element to a widget, a popup appears to select the metric to display. The same happens for properties, parameters, and commands.

Bug fixes
- Fixed bug that sometimes caused an error when saving templates.
- Importing customers/locations via CSV is now visible according to user permissions.
- Fixed error in closing Other filters popup...


Comments
0 comments
Please sign in to leave a comment.