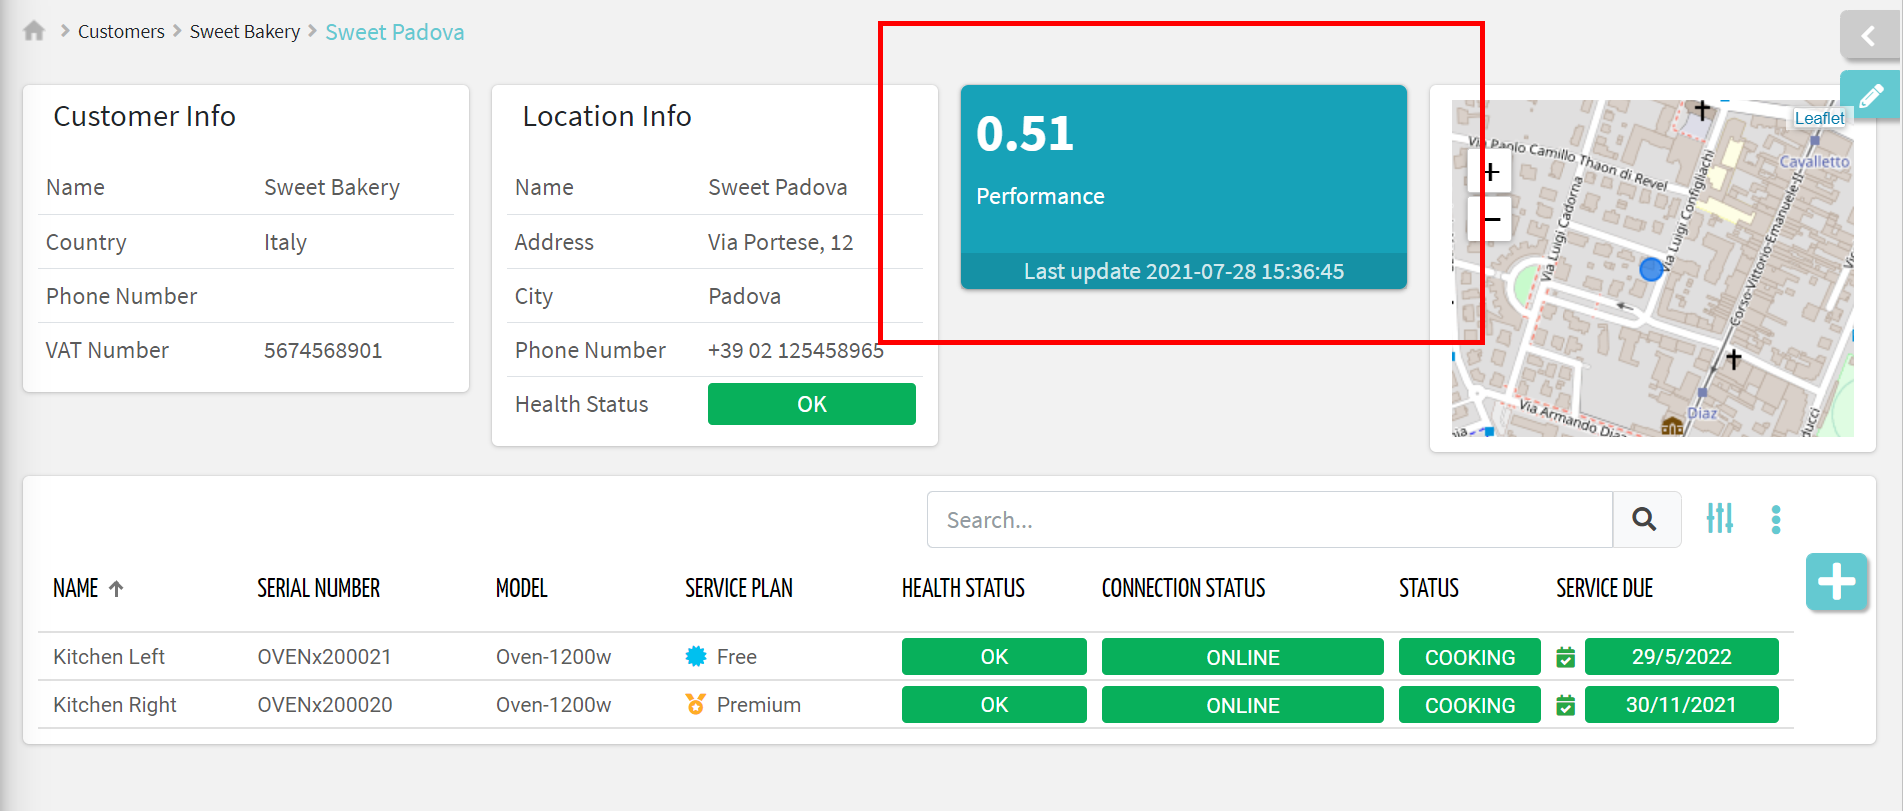
The Insight Metrics can be displayed within the dashboards by using the standard widgets supporting metrics, like:
- Gauge
- Radial Gauge
- Time Series Chart
- Location Details
- Thing Details
- Location List
- Thing List
- Multi Metric List
Displaying Insight values
For instance, here is an example with a Gauge displaying the Performance insight.
<gauge-widget>
   <metric name="performance"></performance>
</gauge-widget>
This is the dashboard rendering:

Sorting by Insight value
When the algorithm computation takes place, each location object is enriched with the metrics node holding the values of the last insight computation.
{
    "id": "5aeae7f44e22a20006f6145d",
    "name": "Location A",
    "metrics": {
        "performance": {
            "value": "0.5136519825098697",
            "lastUpdateTimestamp": 1627479405261
        }
    }
}
This allows for instance to display a list of locations/things and sort by the insight value.
<location-list-widget-v2>
    <property name="name"></property>
    <property name="properties.street"></property>
    <property name="properties.city"></property>
    <property name="thingCount"></property>
    <property name="metrics.performance.value"></property>
</location-list-widget-v2>
Note that, insight properties are not updated when using the Test Algorithm feature within the Insight Metric editing page.

Comments
0 comments
Please sign in to leave a comment.